Debug through the TomEE source code is a must-to-follow step if you want to understand how TomEE works and do some contribution. This is a guide to quickly start your debugging session with TomEE as a TomEE developer.
This guide assumes
- Linux is the OS
- IntelliJ IDEA 13.1.3 is the IDE
- Maven 3.x.x is installed
Here we go!
Download the source code
For beginners I will recommend not to start with the trunk, because It is normal to have some blockers, non-stable functionalists which may cause your learning crashes at some point.
So first start with the latest stable released source code. Go to trunk once you are ready to do some code modification on TomEE.
Click here to download TomEE 1.6.0.2 Source code
Build the Source Code
First extract the zip file named openejb-4.6.0.2-source-release.zip to any location. Lets assume it is your home folder.
unzip openejb-4.6.0.2-source-release -d ~
The above command will create the
openejb-4.6.0.2 directory in your home directory.
Even though you can do a full build, We will run the following command to do a quick build so that you can have your meal before your hungry kills you.
mvn -Pquick -Dsurefire.useFile=false -DdisableXmlReport=true -DuniqueVersion=false -ff -Dassemble -DskipTests -DfailIfNoTests=false clean install
More details about building the product from the source can be found
here.
Deploy TomEE
The TomEE build builds several distributions (zip & war files) to cater the different needs of different users. Here we discuss about the tomee plus distribution & TomEE war distribution only. TomEE+ is the full feature packed distribution from TomEE.
TomEE+ zip location:
~/openejb-4.6.0.2/tomee/apache-tomee/target/apache-tomee-plus-1.6.0.2.zip
Unzip the zip into your home directory (or any other location)
unzip ~/openejb-4.6.0.2/tomee/apache-tomee/target/apache-tomee-plus-1.6.0.2.zip -d ~
You will find the directory
apache-tomee-plus-1.6.0.2 in your home folder. Lets run the TomEE.
cd ~/apache-tomee-plus-1.6.0.2/bin
./catalina.sh run
"INFO: Server startup in xxxx ms" is the Green light!
Prepare your IDE
Lets prepare our IntelliJ IDEA for the debugging session.
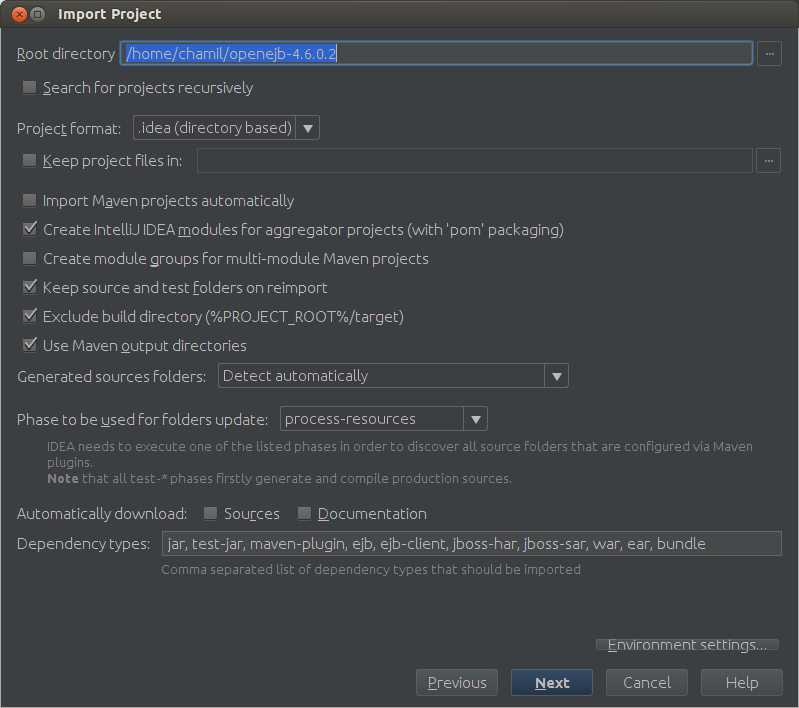
Start IntelliJ IDEA and Click the Import Project link
Select ~/openejb-4.6.0.2to and press OK
Select import project from external model & Maven as the external model.
Press Next on this screen.
Select the main profile.
Select the org.apache.openejb:openejb:4.6.0.2
Select the JDK you want to use with.
Give the project name and press Finish.
Now your IDE will load the project.
First Breakpoint
Next step is to put a breakpoint at the place where the code is triggered. Lets understand how the code is triggered.
TomEE+ is created on top of Tomcat. TomEE registers a Tomcat Lifecycle Listener
"org.apache.tomee.catalina.ServerListener" on
server.xml file.
All the Tomcat lifecycle events i.e. before_init, after_init, start, before_stop etc... are received by the
lifecycleEvent method of the ServerListener.
The execution of TomEE code starts in this lifecycleEvent method. So the first breakpoint should be on the lifecycleEvent method.
Run TomEE+ in debug mode
If you simply run
catalina.sh jpda run in the bin folder of tomee deployment, the server starts in the debug mode but it will quckly pass your breakpoint before you attach your IDE to the server process.
So we set
JPDA_SUSPEND="y" before we start our debugging. This will notice the server, "Do not proceed until the Debugger tool is attached to the process"
The convenient way of doing this is adding this line to catalina.sh file right after the #!/bin/sh line.
#!/bin/sh
JPDA_SUSPEND="y"
Now to time to run TomEE+ on debug mode.
~/apache-tomee-plus-1.6.0.2/bin/catalina.sh jpda run
The terminal should hang with the message
"Listening for transport dt_socket at address: 8000"
Attach IntelliJ IDEA debugger
- Menu Bar > Run > Edit Configurations
- Press the "+" button on the top left corner to get the Add new configuration menu
- Select "Remote" from the Add new configuration menu
- Give a name (I gave "TomEE DEBUG") to this new configuration and set the Port to 8000
- Click OK.
To start debugging your TomEE+
Main Menu > Run > Debug TomEE DEBUG
Congratulations! You hit the break point you put at the startup of the TomEE code. Carry on with your debugging session to learn more.